You must login before you can run this tool.
Category
Published on
Abstract
This Jupyter notebook based tool can be used to plot the comparison results from the Cryosphere model Comparison tool (CmCt).
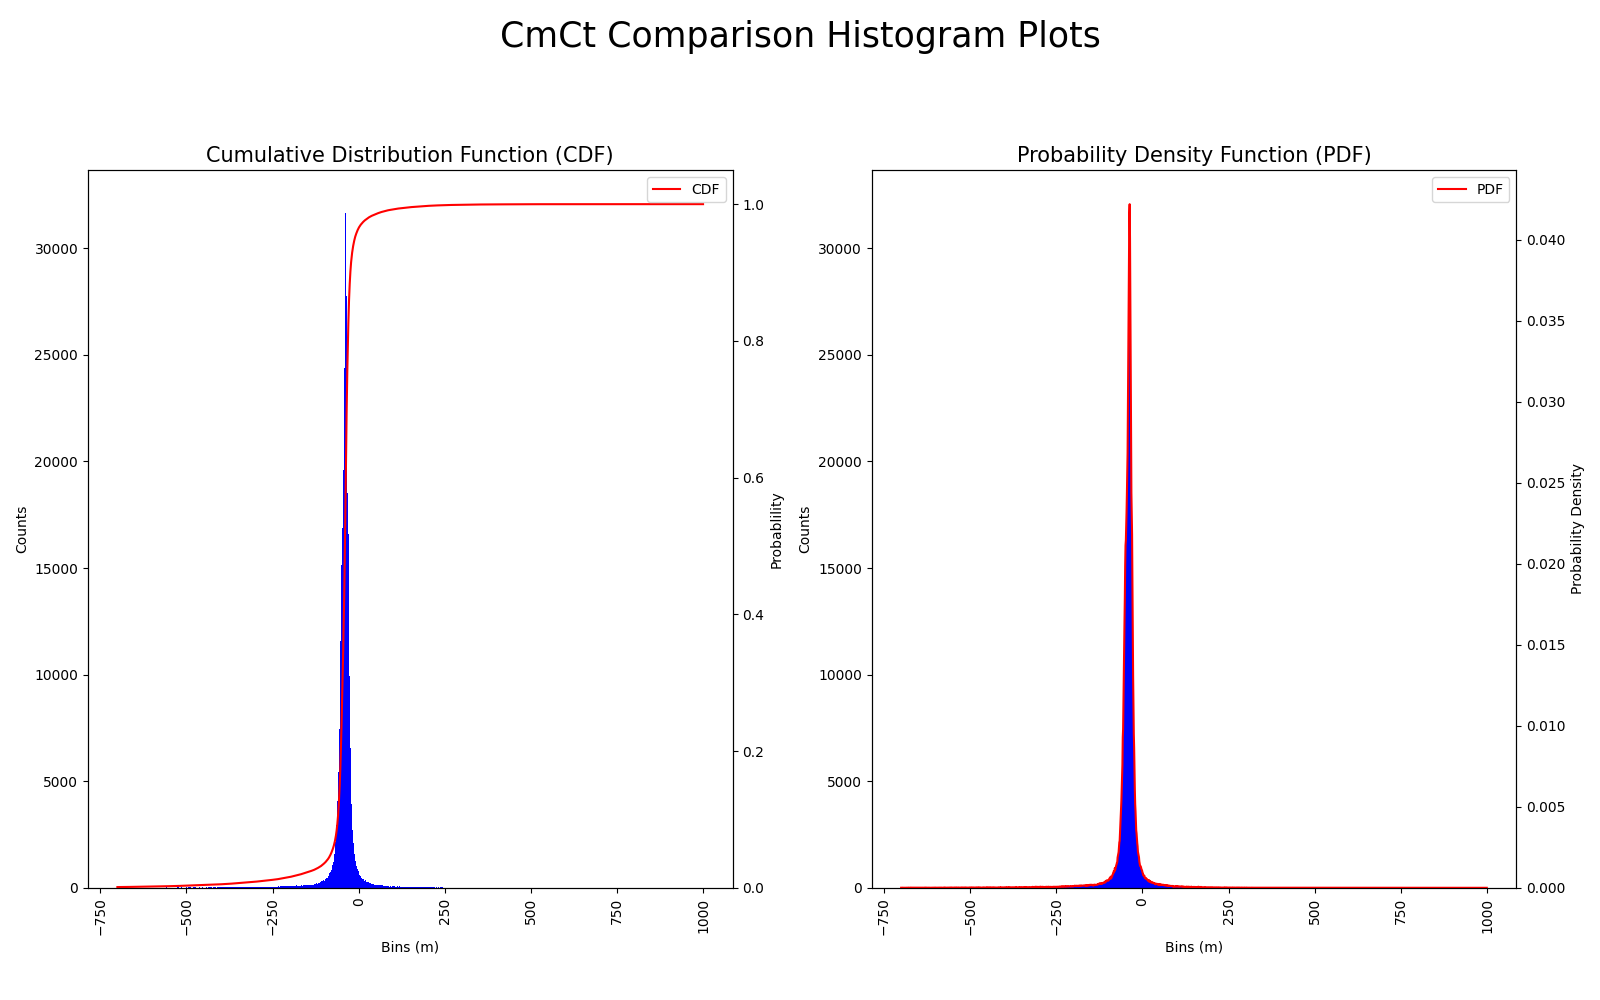
The tool uses a CmCt histogram text file uploaded by the user to plot and display:
- a cumulative distribution function (CDF), and
- a probablility density function (PDF)
Plots are shown side by side for quick assessment of the comparison. The plots can then be downloaded to the user's local machine.
About CmCt
The Cryosphere model Comparison tool (CmCt) is a web-based ice sheet model validation tool that has been developed by NASA to facilitate direct comparison between satellite observational data and various ice sheet models. The CmCt allows the user to take advantage of several decades worth of satellite-based observations from Greenland and Antarctica. The CmCt is used to compare ice sheet models provided by the user with remotely sensed satellite ICESat (Ice, Cloud, and land Elevation Satellite) laser altimetry, ERS-1, ERS-2, and Envisat radar altimetry data, and GRACE (Gravity Recovery and Climate Experiment) satellite data.
Using this tool
The user can upload the histogram text file that was created by the CmCt. After upload, this model file is stored in a folder located within the user's home data directory. The user can then plot the data using the plot button which appears after a file has been uploaded.
The user also has an option to download the resulting plot by clicking on the download botton. The plot will appear in a new browser window.
Example
Plots are shown side by side for quick assessment of the comparison. The plots can then be downloaded to the user's local machine.
Python Libraries
- os
- sys
- warnings
- numpy
- matplotlib
- matplotlib.pyplot
- glob
- matplotlib.rc
- hublib.ui
- ipywidgets
- IPython.display
- IPython.clear_output
- gc
- requests
- atexit
Cite this work
Researchers should cite this work as follows: